
All Wales Core Dataset: Automating customised analysis for thousands of reports

Image Source: Image by Choong Deng Xiang on Unsplash
All Wales Core Dataset: Automating customised analysis for thousands of reports
The All-Wales Core Dataset (AWCDS) is a compilation of educational reports containing a range of information including school performance, attendance and qualification records. The dataset consists of thousands of unique reports that are sent to local authorities and individual educational institutions across Wales. These reports enable schools to perform self-evaluation of learning to support them during the recovery of the pandemic.
In this technical blog we will provide an overview of how we have produced the AWCDS, replacing a decommissioned piece of procured software, with a reproducible analytical pipeline (RAP). This is an interim solution which allows the School Information Policy Branch and Schools Statistics Team within the Welsh Government to continue to easily generate and share reports with stakeholders each year while a permenant solution is considered.
We have used the following tools to meet the requirements for this project:
- Structured Query Language (SQL)
- R programming language (with tidyverse, ggplot and additional packages)
- R Markdown
Using these core tools we have built a single codebase that is:
- able to produce ten different report types
- capable of easily adding items to existing reports or adding entirely new report types
- accessible for users with limited R experience
- efficient in building almost 4,000 individualised reports for a range of stakeholders
Data processes like these are common for organisations that share data with many stakeholders. This blog will explore some of the methods we have used to meet these requirements and share learning to help others complete similar projects.
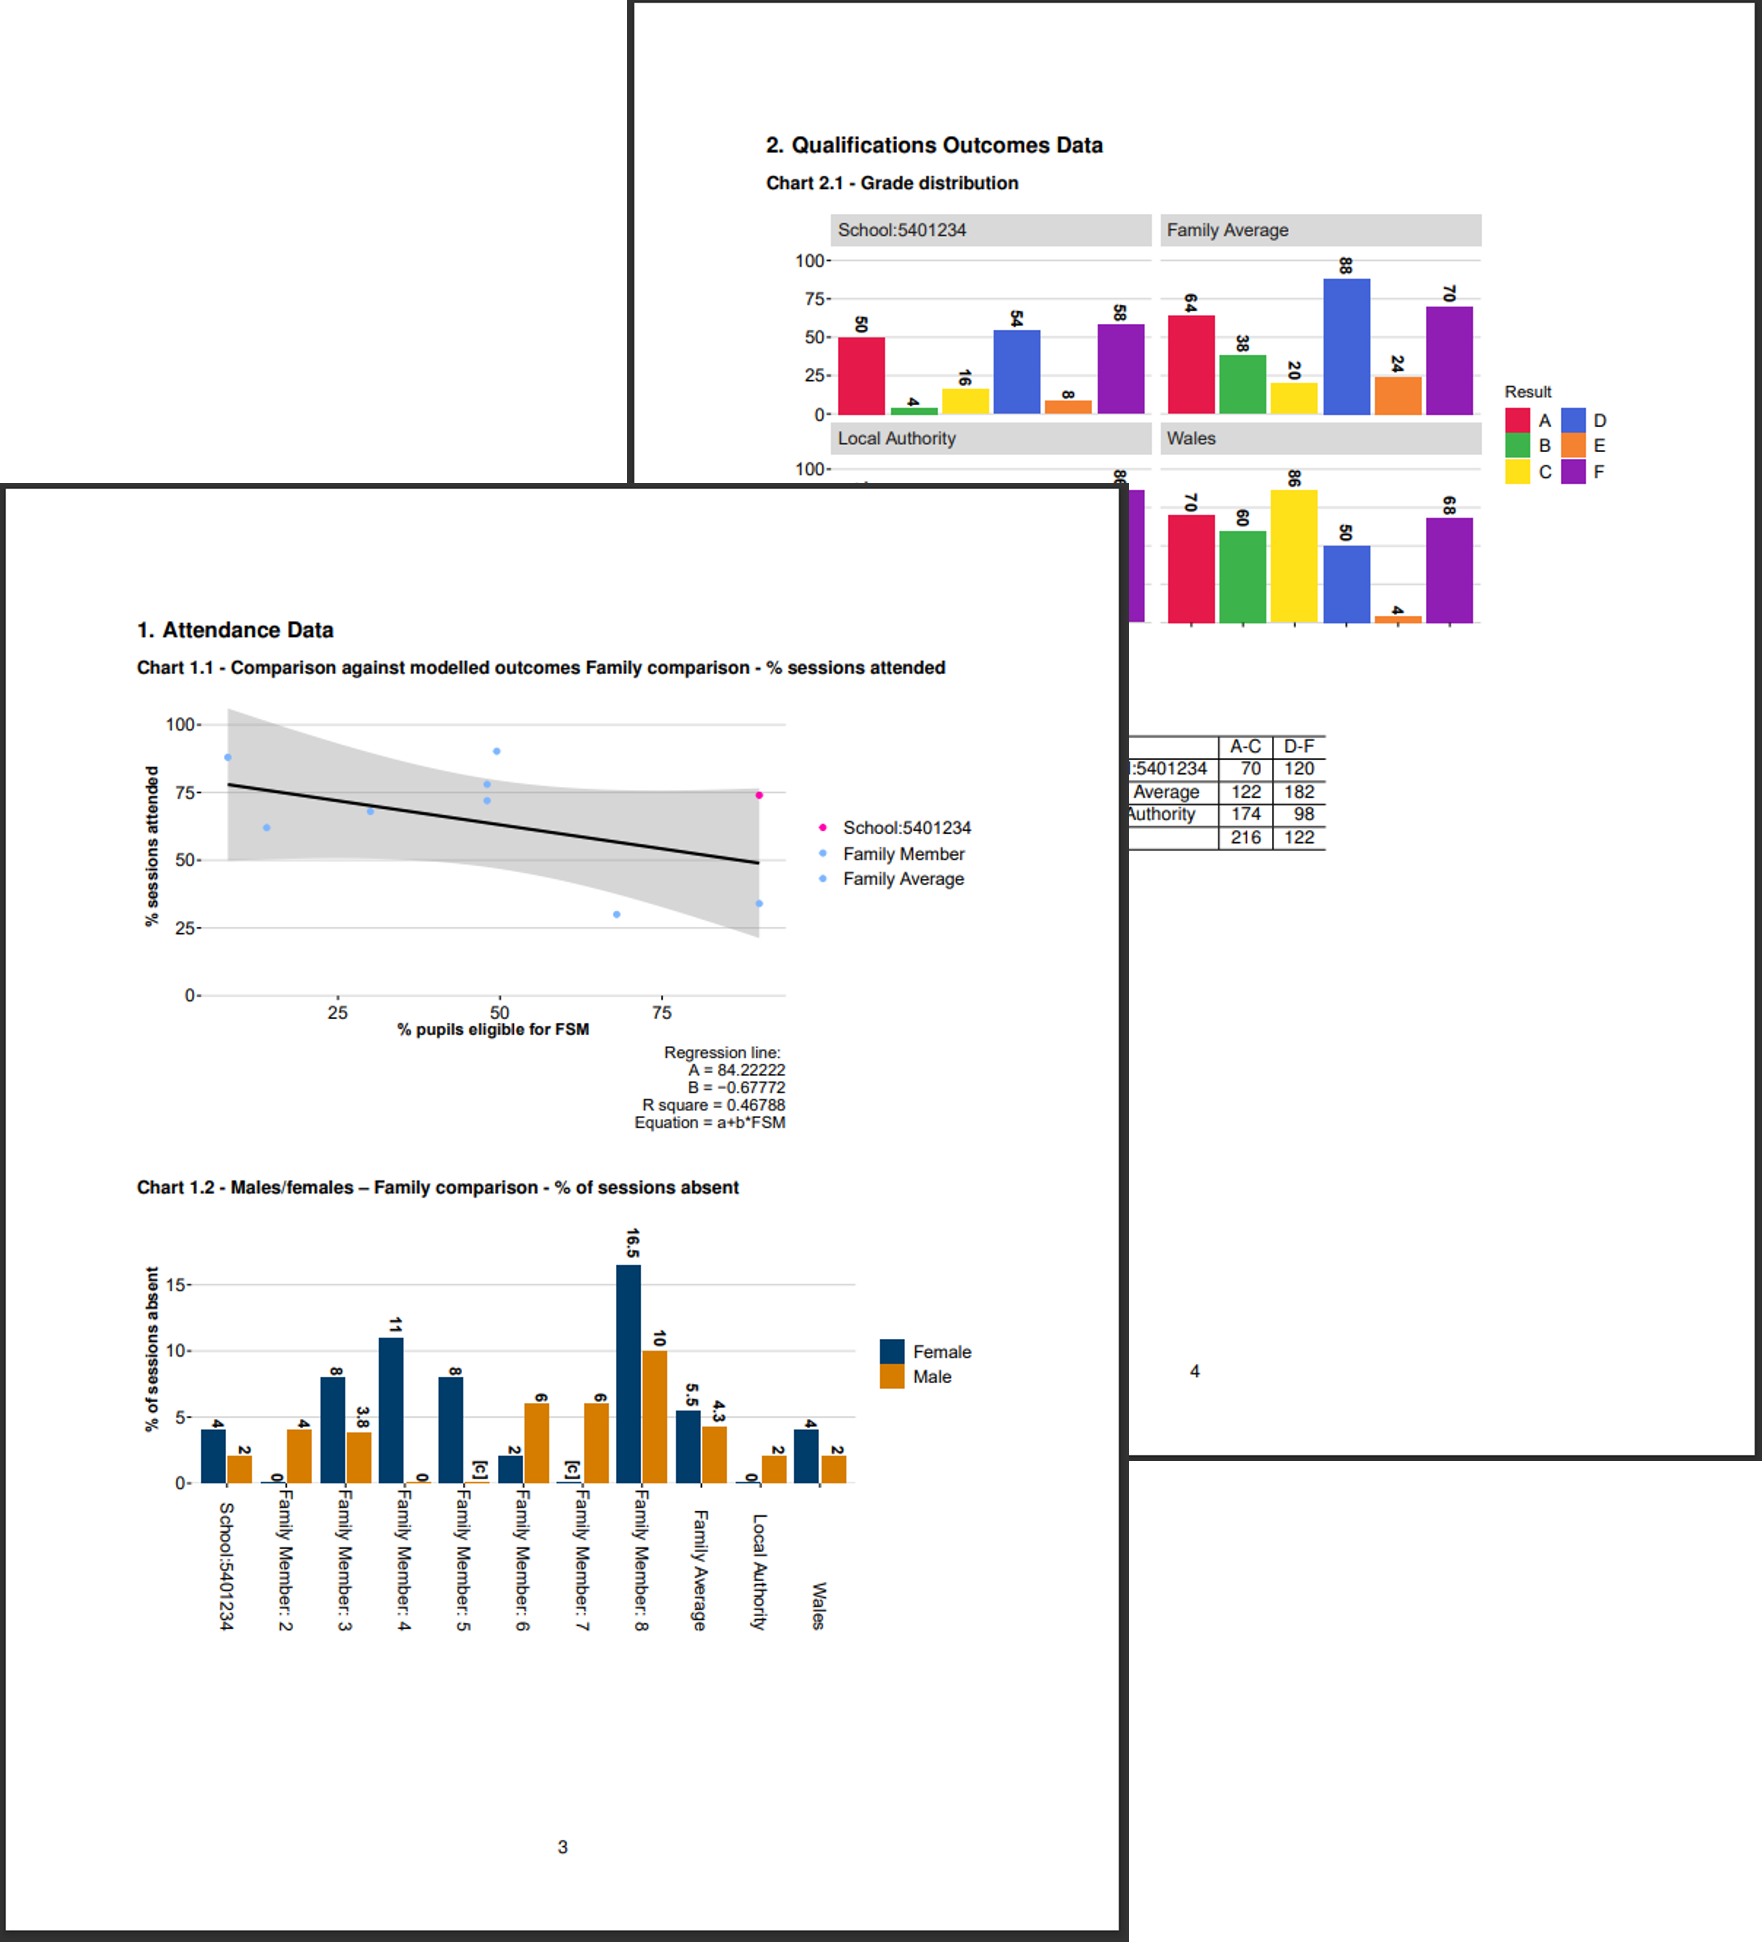
The product of the work is a set of data reports like the ones in the image below. This blog uses fictional data.
Figure 1: Example reports
Project overview
The AWCDS consist of around 4,000 PDF reports shared to approximately 1,200 schools and 22 local authorities in Wales. Each PDF report consist of tables and charts that contain individual data for that school, for example: North Road Primary School will receive one report in a pre-set format containing all their attendance data represented in charts and tables.
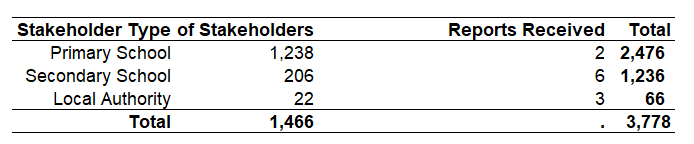
To give a sense of scale the table below shows how many reports are created as part of the AWCDS.
Table 1: Number of reports generated for the AWCDS
We wanted to design a process that would allow us to produce the AWCDS annually, whilst being able to easily integrate any changes to the report year-on-year. For example, changes to data collection processes or policy might affect data formats or the information contained in each report. Our process needed to be robust to handle these changes and the evolving expectations from customers, in a way that would cause minimal disruption when reproducing the reports in future years.
Starting from SQL
A large volume of Welsh Government analytical data is held in SQL databases and maintained by data and statistics teams. This is true for schools’ data which we can access securely using R in a permission-controlled secure environment. Data was processed either using SQL stored procedures or SQL queries stored in .txt files.
SQL queries are useful to efficiently manipulate, process and clean large volumes of data stored in databases. However, these queries can become lengthy and complicated if referencing multiple tables or variables. Therefore, we commonly store SQL queries in .txt files for our RAP projects instead of including them in code or query file formats. Storing queries in .txt files grants three benefits:
- We avoid filling our R code files with SQL query code making them very large and difficult to edit.
- We can version control and track changes in the query files independently to the R code files.
- Users that are familiar with SQL but not R are more easily able to write and test SQL code to contribute to the RAP process.
The SQL queries also enable the automation of the process. We write one SQL query to an individual .txt file for every chart or table used in the AWCDS. These queries are generic so can be re-used multiple times to produce the same type of chart or table but using diffrent data from diffrent schools for each individual report.
JSON files as a recipe
Ideally, a RAP process is easy to use and has minimal steps that require human interaction. We can think of JSON files like a recipe: they include the “ingredients” we need to produce our AWCDS reports. In a JSON file, users can specify what type of graph to create, what data it will contain and what other parameters (like labels and titles) should be added. An example of how this applies to charts is given below.
Figure 2: Examples of a report JSON
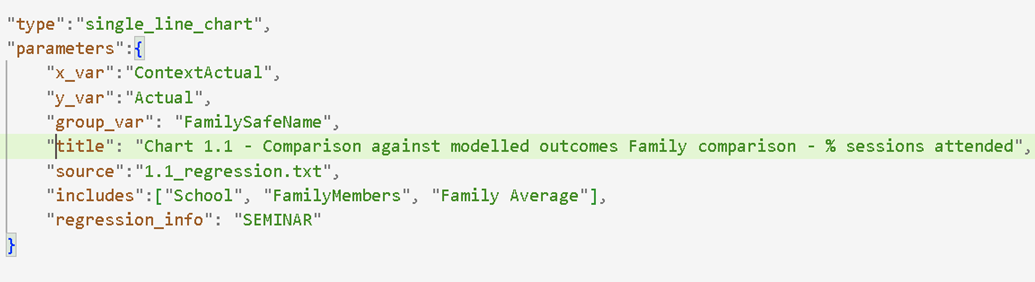
In this example we are building a scatter chart with a regression line. The x_var and y_var parameters are used to dictate what is on the x and y axis. The group_var parameter controls what is used in the legend for the plot. The source parameter indicates the .txt file that contains the generic query that we will use to process the data for this chart.
Sometimes we need to change what data we retrieve from the database, depending on the type of graph being built. We can update the SQL Query to return the right data with other information also defined in the JSON file. For example, the includes parameter in this example, dictates the filter applied to the data. Finally, the regression_info parameter is a key to another lookup table containing the regression parameters (slope, intercept, equation) for the line.
Using a JSON file in this way further engages those without in-depth R experience, as they can still define the building blocks of a report without having to know how to code. This is by no means a low-code solution to building RAP but it is a low code solution to engaging with RAP.
The JSON files used have a one-to-one relationship with the reports produced, meaning for each report (local authority qualifications outcomes, primary school attendance, etc.) there is one JSON file. This makes it clear exactly which JSON file recipe should be altered to see changes in a report.
Building charts and tables
Most of the R Code used in this project is to build the charts for the reports. The code consists of:
- a module for reading data from SQL and doing some basic transformations and suppression
- a module for producing tables formatted using the kable package
- one module per chart type including bar charts, grouped bar charts and scatter plots with optional regression lines
- a module containing helper functions to format charts including selecting colour schemes and scaling axis
- a module for logging
- a module for producing raw data files based on the data used in the PDF reports
- a module for quality assurance
Using a modular approach keeps the code easy to maintain. If there is a problem with suppression for example, it only needs to be fixed in one place. Further, having an individual module per chart means that the chart code can be kept simple and specific to each chart types unique requirements.
We have also used the AWCDS as an opportunity to practically test our solution to automating the production of high quality, accessible charts that conform to Welsh Government guidance for external publications. To do this we use KASStylesR, an R package we developed as a ggplot2 theme wrapper. The package is available for you to modify to your organisation standards here. You can read more about KASStylesR here.
Figure 3: Example of charts formatted by KASStylesR
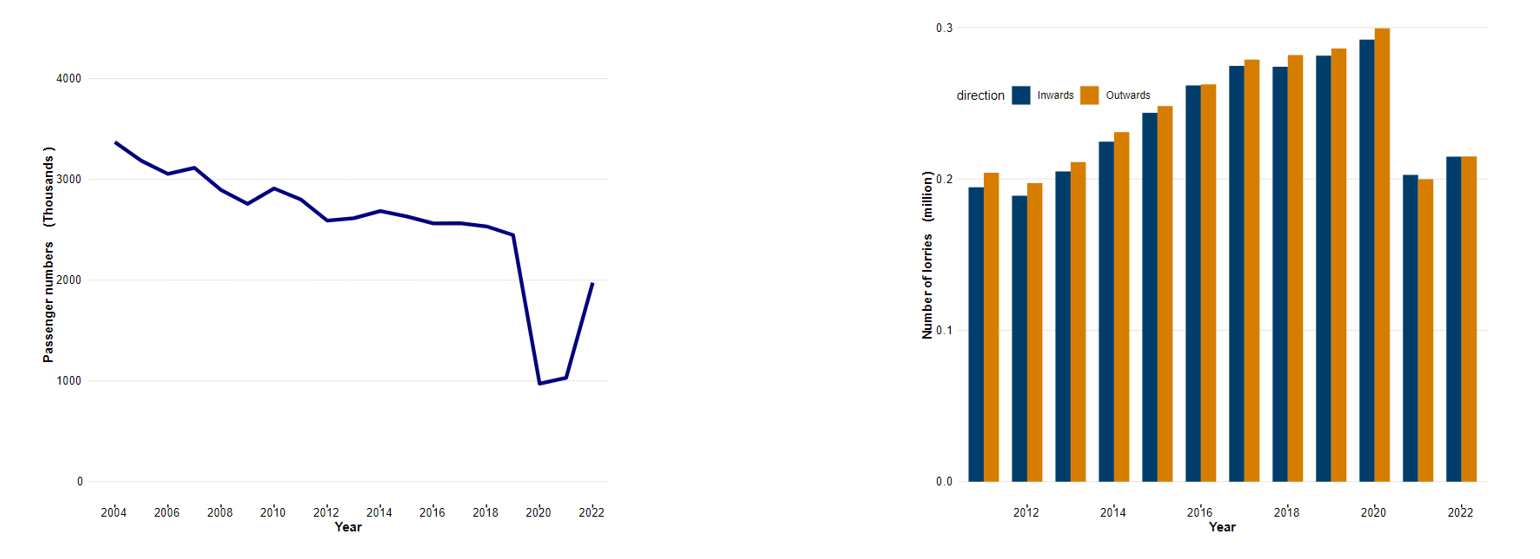 Image Source: Sea Transport Statistics, Welsh Government
Note: These charts are not from the AWCDS
R Markdown to build different report types
The R Markdown files are maintained with a one-to-one relationship to the AWCDS report types produced. This means that for each report type (for example, primary attendance, qualifications outcomes, secondary attendance) there is one R Markdown file.
In some cases, there are format changes in how charts and tables are displayed, in other reports there are individual chart types that appear only once. This is where there is a benefit in having a Markdown file for each report type . The work that can be generalised is done in the modular files, which can be easily re-used across all reports, whilst bespoke edge cases are built directly in Markdown.
Implementing bilingual reports
AWCDS reports are produced in both English and Welsh language.
To achieve this we have taken a two-step approach:
- All data items are translated and referenced in central look up tables, this covers things like category labels
- All pieces of text within the reports (such as titles, notes and exis labels) are stored in two JSON files, one for Welsh and one for English. This enables preports to be generated in both languages just by reading in text from the corresponding files.
Working in this way reduces the workload required for future translation as category labels and chart titles will likely remain the same year on year and only text such as supporting notes, may need to be updated.
Tying it all together
So far, we have covered:
- extracting data
- building report recipes in JSON files
- writing modules to work with data
- using those modules in Markdown to produce PDFs
The final piece of the puzzle is gluing together all of these items. This is done through a central main.R script. Before this, we need to decide:
- which AWCDS reports to produce,
- what list of stakeholders to produce them for,
- which years of data to use and where to store the reports.
Instead of creating multiple different main.R files to generate different repots, we define these parameters in a central main.json file.
Effectively users setup the main.json file to define what reports they want to build and then hit run on the main.R script to generate the AWCDS reports for the specified stakeholders.
The AWCDS data is also shared with schools in raw Excel format. This enables schools to perform their own analysis on the data which is provided in machine readable format as an alternative to the report.
All schools data is quality assured by the School Statistics team as a routine exercise before the AWCDS are produced. Before sharing the reports, a sample of reports for each report type are reviewed by domain experts in the School Information and Inspection Policy Branch.
Wrap up
This blog has given an overview of our work alongside statistics and policy teams to implement and embed a RAP in the organisation for this interim process. The codebase will continue to be used for producing the AWCDS for the foreseeable future by the School Statistics team with support from the Data Science Unit. Previously, the AWCDS production had been procured at a greater cost than the solution developed internally showing how RAP can deliver high quality products in a more cost-effective way. Wider than this work, the statisticians in Welsh Government are increasingly developing RAP solutions to modernise data processes across the organisation.